 Login / Register
 Search
 Menu
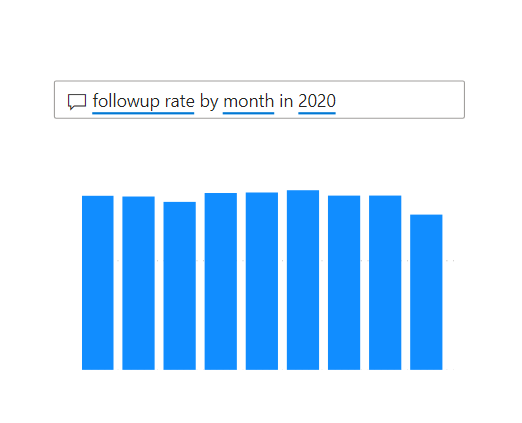
MenuThe 7-day follow up (also known as acute inpatient post-discharge community care) indicator data dashboards measure the percentage of acute inpatient discharges that are followed up in the community setting within the 7 days immediately following discharge from an acute inpatient stay.
Why
Literature indicates the time following discharge from inpatient mental health services can be a vulnerable period for some people. Commonly studied issues associated with the transition from inpatient to community care include early readmission and suicide.
Evidence identifies factors that increase people’s likelihood of early readmission, such as having no plans to be followed up after discharge, and insufficient or a lack of comprehensive discharge planning (Callaly et al., 2011; Durbin et al., 2007; Steffen et al., 2009).
Early readmission indicates that people may not have received adequate support from inpatient services; continue to experience high levels of distress; are underprepared for community living; have limited community or whānau support; or experience challenges in accessing community or culturally relevant services (Donisi et al., 2016; Durbin et al., 2007)
The literature highlights a concerning proportion of people who die by suicide within the first week or month following their discharge from inpatient mental health services. In Aotearoa New Zealand, of the 476 people who died by suicide in 2015, 201 people (42 percent) had contact with specialist mental health services the year prior. Of all tāngata whai ora who were in contact with mental health services in the year prior to dying by suicide between 2001 and 2015, 171 people (nearly 7 percent) died within 1 week of discharge (Manatū Hauora Ministry of Health, 2019).
Click here to read more evidence about this indicator.
Populations
7-day follow up indicator data dashboards are built using criteria specific to adult populations (20-64 years), but also provides age filters for child and youth (0-19 years) and older people (65 and over), where this data is reported by services into PRIMHD. Click here to learn more about PRIMHD.
All KPI Programme indicators provide demographic information by age, gender and ethnicity.
Data available through April 2025, sourced from the 28 May 2025 refresh of the PRIMHD DataMart.
Please note:
- Tairāwhiti has lower volumes from July 2023 to March 2024 and very few inpatient discharges since September 2024
- Nelson Marlborough has lower volumes from January 2025
If you have any improvement ideas or feedback please email us at mhakpi.health.nz