 Login / Register
 Search
 Menu
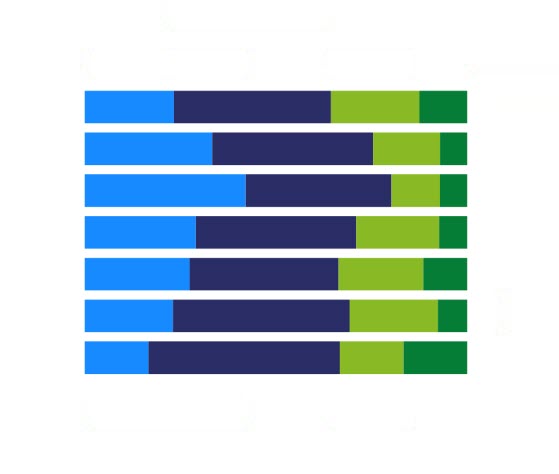
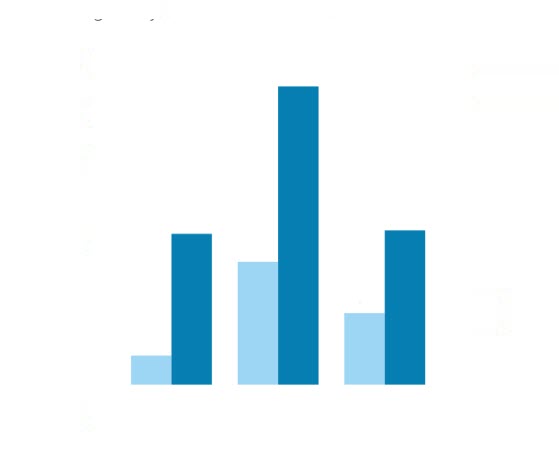
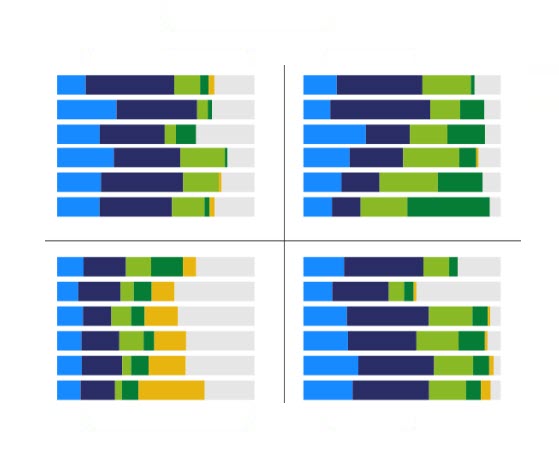
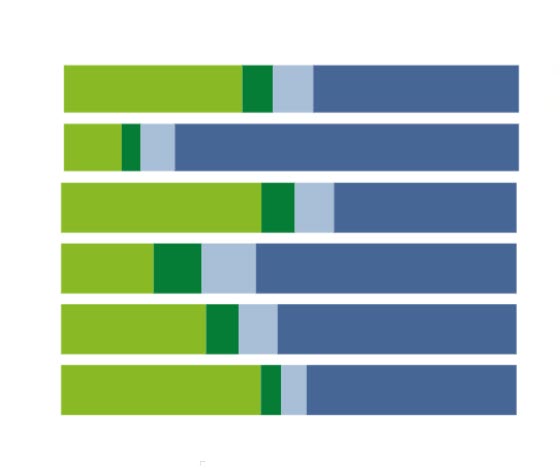
MenuWait times indicator data dashboards talk to the length of time between the day a tangata whai ora is referred to a mental health or addiction service and the first day that tangata whai ora is seen by the service. Dashboards also provide information on time to third inscope activity – This proxy time to treatment marker was identified by contributors to the KPI Programme’s Child and Youth stream as the most probable point for therapeutic intervention to occur.
Why
He Ara Oranga (Government Inquiry into Mental Health and Addiction, 2018), the Ministry of Health (2012), and the Health Quality and Safety Commission (2021) have identified reducing wait times as a priority to increase service accessibility for all people experiencing mental health challenges and problematic substance use. Concerningly, New Zealand continues to have one of the highest youth suicide rates in the world (UNICEF Innocenti, 2020). Approximately two-thirds of mental health conditions onset before age 25 (half before age 18 and one-third before age 14) (Solmi et al., 2021). Click here to read more evidence about this indicator.
Populations
Wait times indicator data dashboards are built using criteria specific to Child and Youth populations (0-19 years), but also contains information for Adult (20-64 years) and older person (65 and over), where this data is reported by services into PRIMHD. Click here to learn more about PRIMHD.
All KPI Programme indicators provide demographic information by age, gender and ethnicity.
Data available through April 2025, sourced from the 26 June 2025 refresh of the PRIMHD DataMart.
Please note:
- MidCentral has low volumes from March 2025.
- Northland and Hawkes Bay has lower volumes from April 2025.
If you have any improvement ideas or feedback please email us at mhakpi.health.nz