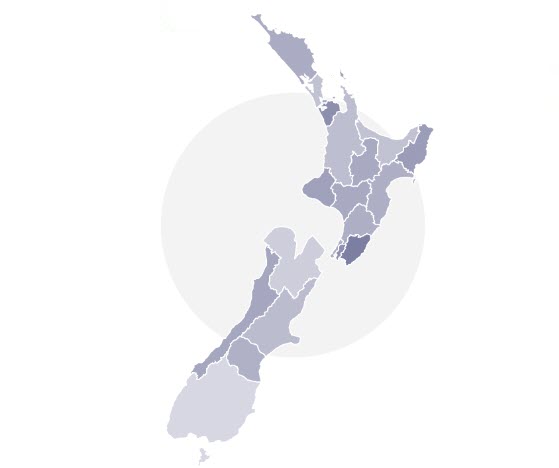
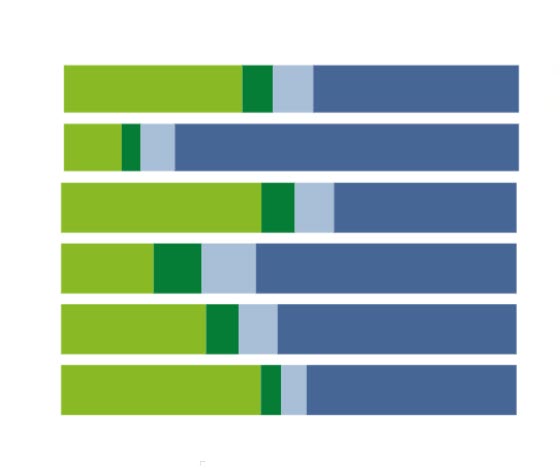
The Whānau engagement indicator provides two data dashboards.
The tāngata whai ora view summary provides a national overview of whānau engagement from a tangata whai ora perspective. It includes the percentage of tāngata whai ora with whānau engagement within the selected quarter, split by Te Whatu Ora division and demographics, as well as patterns of whānau engagement over time.
The service episode summary provides a national overview of whānau engagement from a service episode view rather than a person view. For all service episodes started within the selected quarter, it provides the percentage that had whānau engagement and explores the wait times between a service episode’s first in-scope activity and its first whānau engagement, and the average number of days to first whānau engagement.
Why
Whānau engagement is associated with positive individual and service level outcomes. Individual outcomes include greater wellbeing and a stronger support system through a person’s service journey (Haine-Schlagel & Walsh, 2015; Hogue et al., 2021; Ungar & Theron, 2020). Service level outcomes include a lower likelihood of readmission to services and missing appointments (Aeby et al., 2015; Durbin et al., 2007; Hariman et al., 2020; Vigod et al., 2013).
Various factors can hinder the engagement of whānau with services. For whānau, barriers include not being given enough information or advice by services, lack of support for whānau who are involved in a person’s service journey, or not wanting to be involved (Liverpool et al., 2021; Waid & Kelly, 2020). For services, the literature highlights issues including a lack of training, resources, and capacity (Baker-Ericzén et al., 2013; Boland et al., 2019). Services need to be attentive to the complexities of whānau dynamics when facilitating whānau engagement. This includes services recognising when tāngata whai ora may not want whānau to be involved (Bradley & Green, 2018; Waller et al., 2019).
Kia Manawanui Aotearoa, the long-term pathway to improving mental wellbeing, identifies as a priority the need to integrate whānau-centered models of care, mātauranga Māori (Māori knowledge), and Pasifika models of wellbeing into services (Manatū Hauora Ministry of Health, 2021). Click here to read more evidence about this indicator.
Populations
The whānau engagement indicator dashboards are built using criteria for all populations, where this data is reported by services into PRIMHD. Click here to learn more about PRIMHD.
- Aggregated ‘All NGO’ data is provided using the ‘Organisation’ filter in this indicator.
- All KPI Programme indicators provide demographic information by age, gender, and ethnicity.
- Please note as of April 2023 the mandation date for submitting whānau engagement in community settings in PRIMHD has been moved back to 1 July 2024.
Data available through December 2023, sourced from the 26 June 2024 refresh of the PRIMHD DataMart.
Please note:
- Tairāwhiti have complete data up till the end of June 2023
- Southern has complete data up till the end of August 2023
If you have any improvement ideas or feedback please email us at mhakpi.health.nz


 Login / Register
 Search
 Menu
Menu

