Acute inpatient 28-day readmission

Acute inpatient 28-day readmission, or 28-day readmission, indicator dashboards measure the percentage of tāngata whai ora who return to inpatient mental health services within 28 days after discharge.

Why

People experiencing mental health challenges can experience various issues following their transition from an inpatient service to their community (Sather et al., 2018; Tyler et al., 2019). Around 16 percent of people leaving inpatient mental health services are readmitted within 1 month and 40 percent are readmitted within 1 year (Kripalani et al., 2014; Madi et al., 2007; Mark et al., 2013; Wheeler et al., 2011).

People may not have received adequate support, continue to experience high levels of distress, have issues with taking medication, be unprepared for community living, have limited community or whānau support, and experience challenges in accessing culturally responsive services (Adeponle et al., 2009; Donisi et al., 2016; Durbin et al., 2007; Gunnell et al., 2008; Haselden et al., 2019; The Key Performance Indicator, Mental Health and Addiction Services Aotearoa New Zealand, 2021; Tulloch et al., 2016; Vigod et al., 2013; Zhang et al., 2011).

Readmission may therefore indicate unmet needs for people discharged from an inpatient mental health unit. Addressing readmission is critical in ensuring tāngata whai ora (people seeking wellness) are supported to live well in the community following discharge, and to make efficient use of service and staff resources. Click here to read more evidence about this indicator.

Populations

The 28-day readmission indicator dashboards are built using criteria specific to adult populations (20-64 years), but also provides age filters for child and youth (0-19 years) and older people (65 and over), where this data is reported by services into PRIMHD. Click here to learn more about PRIMHD.

All KPI Programme indicators provide demographic information by age, gender and ethnicity.

Data available through December 2023, sourced from the 26 March 2024 refresh of the PRIMHD DataMart.

Please note:

  • Canterbury and Tairāwhiti have complete data up till the end of June 2023
  • Southern has complete data up till the end of August 2023


If you have any improvement ideas or feedback please email us at mhakpi.health.nz

Data dashboards

National summary

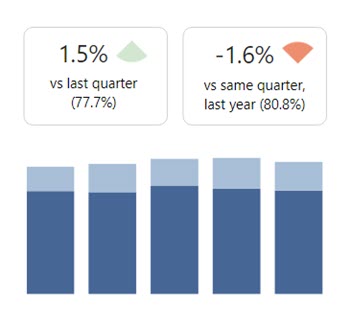
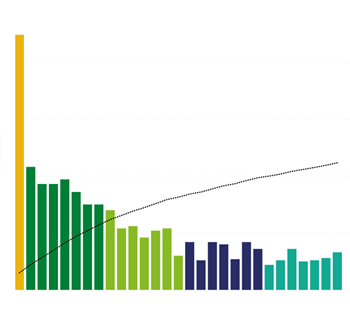
This report provides a national overview of 28-day readmission rates within a single financial quarter. It includes changes in national 28-day readmission rates through time, as well as the 28-day readmission rates for each Te Whatu Ora division compared against the national average.

Within individual divisions, the 28-day readmission rate can be compared against either the previous quarter or the same quarter in the previous year.

The entire report can be filtered by financial quarter and team target population, as well as key demographics: age, gender and prioritised ethnicity.

View report

View report in a new tab

Hide this info

Te Whatu Ora division summary

This report provides individual Te Whatu Ora division summaries, by either financial year or quarter. 28-day readmission rates are split by age, gender and prioritised ethnicity, and raw data is provided for crosscheck in your local system.

View report

View report in a new tab

Hide this info

Readmission details

This report explores the details of readmissions – when do tāngata whai ora readmit, where do they readmit, and for those who do readmit, were they followed up within 7 days after their initial acute inpatient discharge?

The subset of initial acute inpatient referrals can be filtered by division, target population, and discharge date, and you can adjust the threshold of readmission days away from just 28 days if necessary. Raw data is also provided for crosscheck in your local systems.

View report

View report in a new tab

Hide this info

Explore trees

This report is shared with 7-day follow-up.

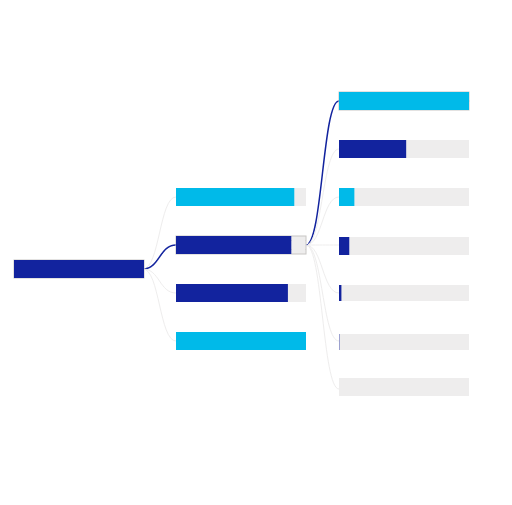
Explore trees allow you to drill down through the 28-day readmission data in any order you like, exploring and comparing different cohorts and time periods. This report includes both a simple and advanced trees, as well as several examples with explanation and discussion. This report also incorporates 7-day follow-up data, so you can switch between the KPI rates or explore counts of referrals both followed up and readmitted.

View report

View report in a new tab

Hide this info

Ask me anything

This report is shared with 7-day follow-up.

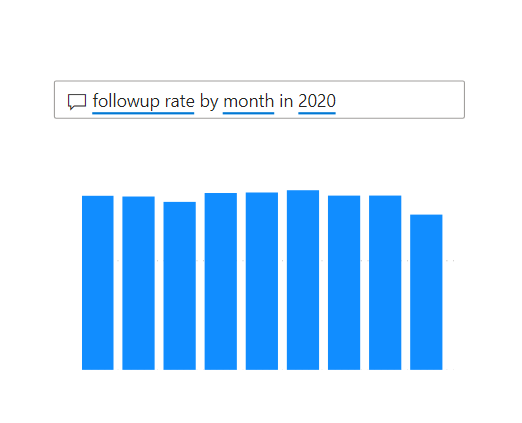
This is a natural language processor – type in a question or something you want to see, and the data will answer.

Both the 7-day follow-up and 28-day readmission datasets are available to this tool, so you can explore the relationships between these two acute inpatient KPIs. Every question you ask helps it to learn and if you have time, you can leave feedback about how it answers each of your individual questions.

View report

View report in a new tab

Hide this info